

If you prefer numerical data over visual charts, you can include a Statistics Report on your dashboard to display structured data in a tabular format.
You can add any of the Statistics Reports that are accessible to you.
STEPS TO ADD
- Click on the tab where the widget will be placed:
- Open the tab's dropdown menu and select 'Add Widget'.
- In the Choose Homepage Widget field, select Statistics Report.
- Note, if you have already added a Statistics Report to your selected tab you will be blocked from adding another one.
- Now, in the 'Statistics Report' dropdown, select the one you would like to add:
- You can add any report that you have access to.
- The following guide will walk your through creating a statistics report: Creating reports (data tables).
- Click 'Save'.
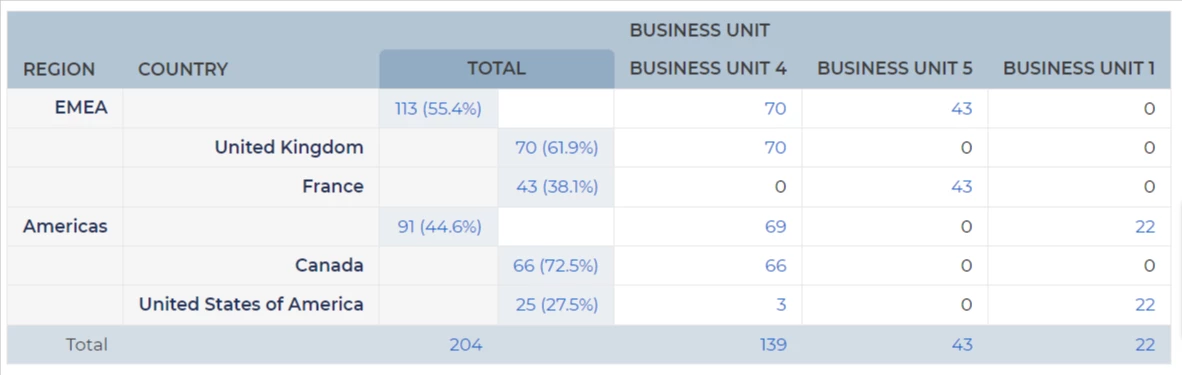
- The widget is now displayed on your selected tab:
- Clicking on numbers in the tables will take you through to the details.
One Statistics Report per dashboard tab: To ensure system performance, you can add only one Statistics Report per dashboard tab.
