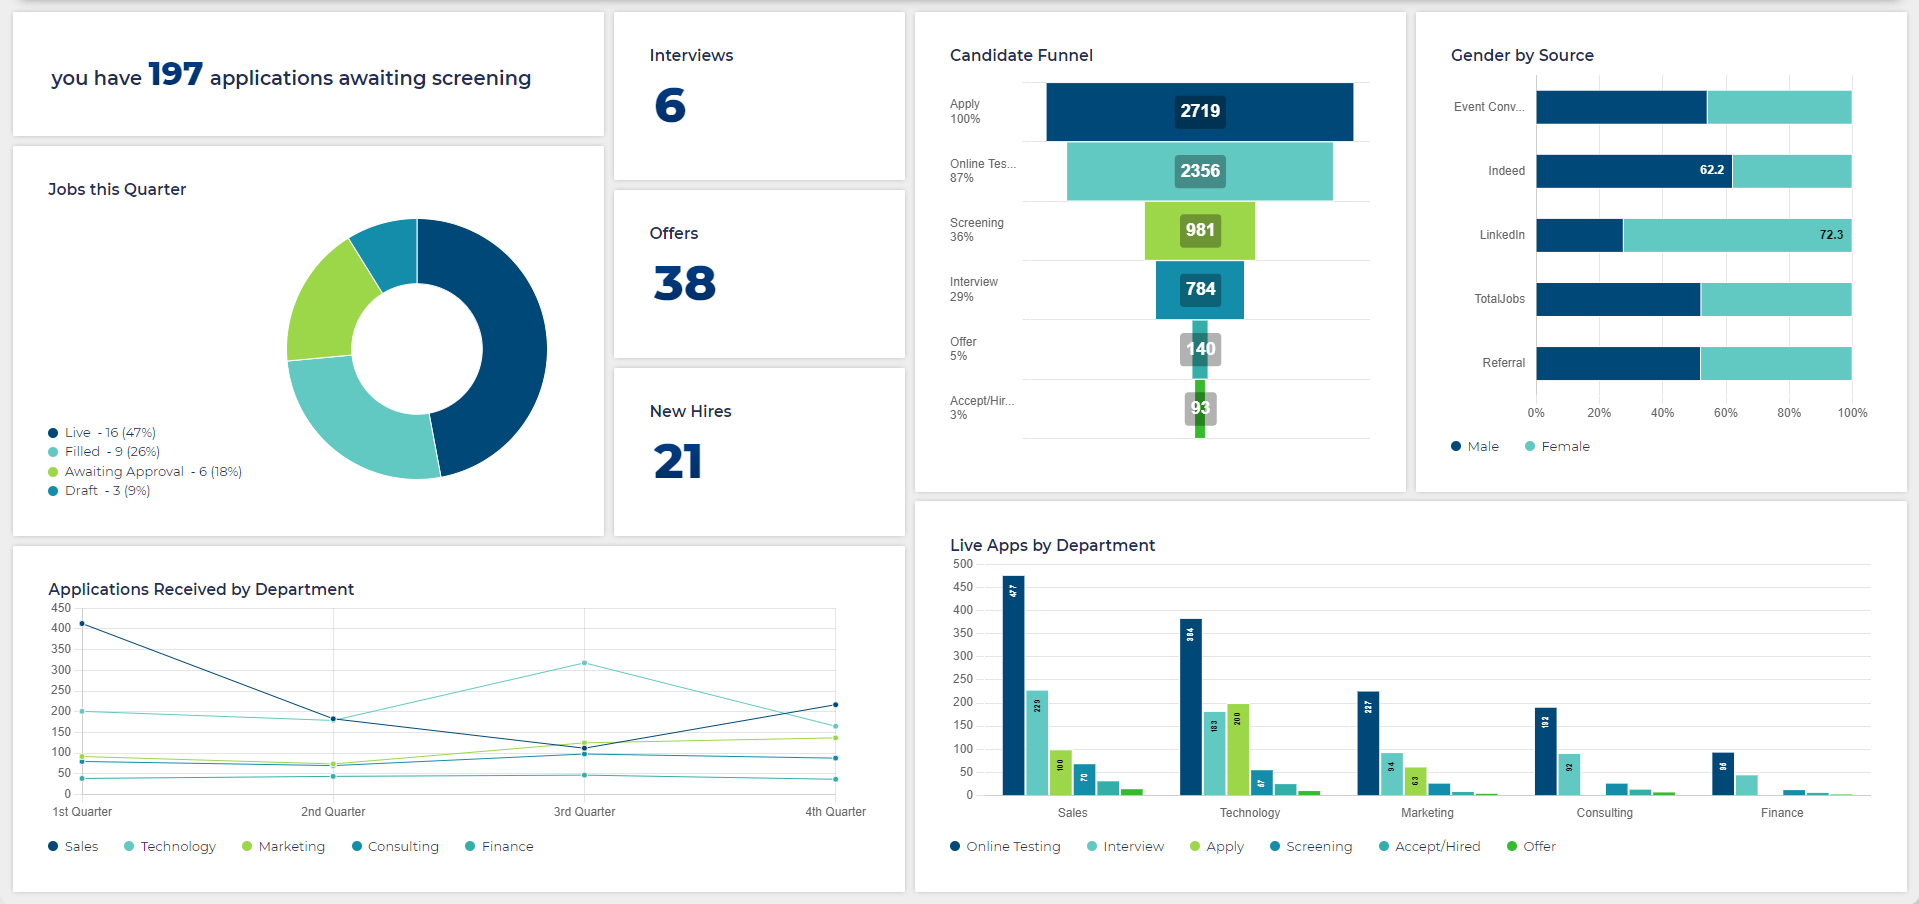
The Report Hub allows you to build and customise analytical reports with various charts, tables, and more. Once built, a report can be either scheduled to be sent out at regular intervals to stakeholders or added to your homepage to ensure this data is immediately available on your dashboard the moment you login.
BEFORE YOU START, CREATE THE REPORT DATA TABLES
Before you begin assembling your Report Hub report, you will need to create data tables that will provide the data source for any charts that you add to your Report Hub report.
Consider the number of axis charts can display:
- Bar Charts, Stacked Bar Charts and Polar Area Charts can display 2 axes - The first vertical axis and the horizontal axis will be displayed in the report.
- Line Charts, Pie Charts, Doughnuts, Radar Charts, and Funnel Charts only one axis - When the data table used as the data source contains multiple axes, these charts will consistently represent the first axis of your chosen statistics report.
Reports sent from system show all data for the population:
When viewing reports in Report Hub, you'll only see data for the opportunities you have access to. However, when you send the report to someone else, it includes all relevant opportunities and applications based on the report's criteria.
Additionally, if you mark the report table as 'Private,' it won't be visible to other users, but it will still display correctly when sent to recipients.
CREATING A NEW REPORT HUB
Once you have created your data tables, you can create your Report Hub:
- In the left-hand menu, navigate to Statistics > Report Hub.
- You will be taken to the Report Hub homepage which consists of a list of reports that you have either been given access to or have created yourself.
- In the top right of this page, click New Report
- In the box that opens, enter the details for your new report.
- Report Name:
- Give the report a name that succinctly describes its purpose and contents.
- Public or Private:
- Public means that it is available to all users who have access to the Report Hub tool.
- You can choose private while you are configuring the report, then change to public when you are ready to make it available to other users.
- Includes PDF / Without PDF
- The email sent to subscribers will always include a link to a webpage containing the report.
- Choose whether it will also include a PDF when emailed to subscribers.
- Report Name:
- Click Create Report.
- Upon clicking Create Report, a new report will be created and you will be taken to the Report Builder tab.
USING THE REPORT BUILDER
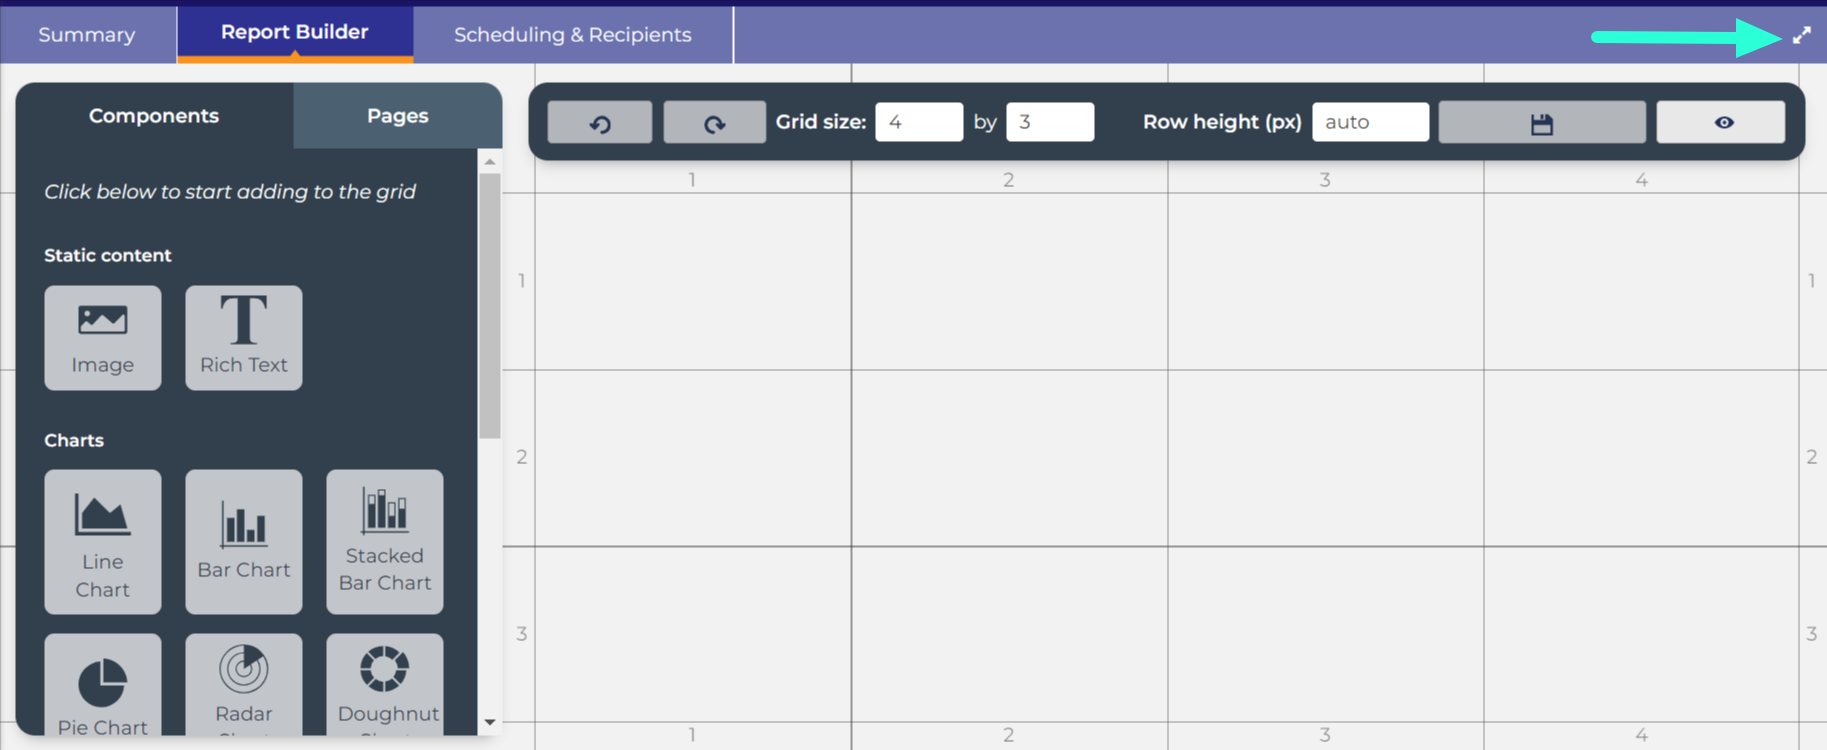
Upon first reaching the Report Builder tab of a new report, you will see a components/pages menu on the left and an empty grid to the right of that.
Towards the right hand side of your screen, you should see a fill screen icon. Clicking this will expand the report builder view so that you have more space to build your report.
Customising the Grid
The grid is where you add components to your report.
Grid Toolbar

- Undo/Redo: Select these button to undo an action or redo one.
- Grid Size: Here you can control the number of columns and rows that your grid has. As you build and customise your report, you can keep altering the Grid size to ensure your report is looking its best. Most screens are landscape view so typically reports look better with more columns than rows.
- Row height (px): This is where you cab select a row height in pixels, or leave it on Auto if you prefer the rows to size automatically to fit the screen.
- Save Changes: Please remember to click this button after making changes to the grid. If you navigate away from your report without clicking the button your changes will be lost.
- Preview: This button will show you what your report will look like when it is viewed.
Adding Components to the Grid
You can incorporate various components — static content, charts, and analytics — into your Report Hub grid.
View the overview: Overview of Report Hub components
Follow these steps to add a component to the grid:
- Prepare Data Tables:
- Before adding charts or analytics, create data tables as the data source. Learn how to do this in the data table creation guide.
- Navigate to the 'Report Builder' Tab:
- Access the 'Report Builder' tab within your Report hub.
- Select Component Type:
- In the report builder menu to the left of the grid, click the static content, chart or analytic you wish to add.
- Place the Component:
- Click the cell in the grid for the component's top left-hand corner.
- Click another cell for the component's bottom right-hand corner.
- Complete the the fields in the pop-up window:
- Fields vary based on the component type.
- For all components:
- It is optional to provide a title and description.
- Text entered here will appear above the component in the report.
- For charts, select the Statistics Report and Limit Categories:
- Statistics Report:
- Choose the Data Table as the data source (mandatory).
- Limit Categories:
- Use this field to restrict the number of categories shown in the chart.
- The default is 10.
- To ensure all categories are included, enter an sufficiently large number.
- Statistics Report:
- Add the report
- Click 'Update' to add the report.
Editing, Resizing, Moving and Deleting Components
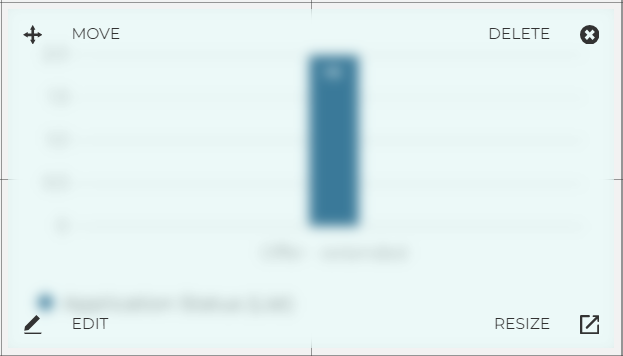
Once the component is added, you can easily Edit, Resize, Move, and Delete by hovering your cursor over it and using the options displayed in the corners of the component.
Adding Pages
The components in your Report Hub can be organised across multiple pages.
To add an extra page, go to the 'Pages' tab in the Report Builder menu.
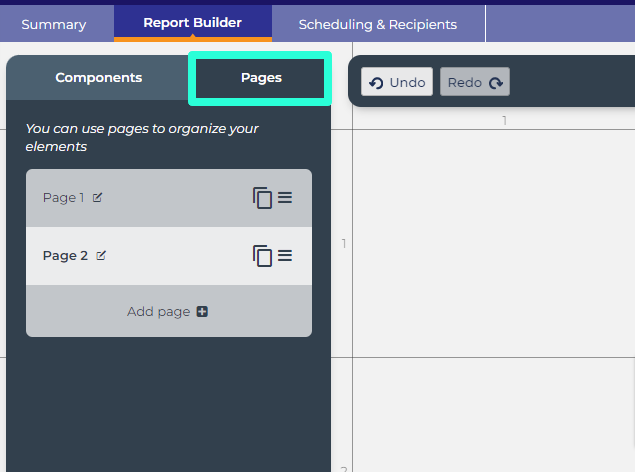
- Click 'Add page' to create a new page.
- Click the edit icon (pencil-to-paper) next to the page title to assign a name.
- Use the three horizontal lines icon to drag and drop, changing the page order.
- Click on a page to access its grid.
- Click the duplicate icon (overlapping pages) to copy a page.
Remember to Save Changes
The report does not save automatically:
- Changes made on the Report Builder page do not save automatically.
- Be sure to click the 'Save Changes' button in the grid toolbar before navigating away from the page.
SCHEDULING & RECIPIENTS
Within the Scheduling & Recipients tab, you can set when and at what frequency your report is emailed out as well as who receives the email. In addition to this, you can also add more editors to help you build out the report further.
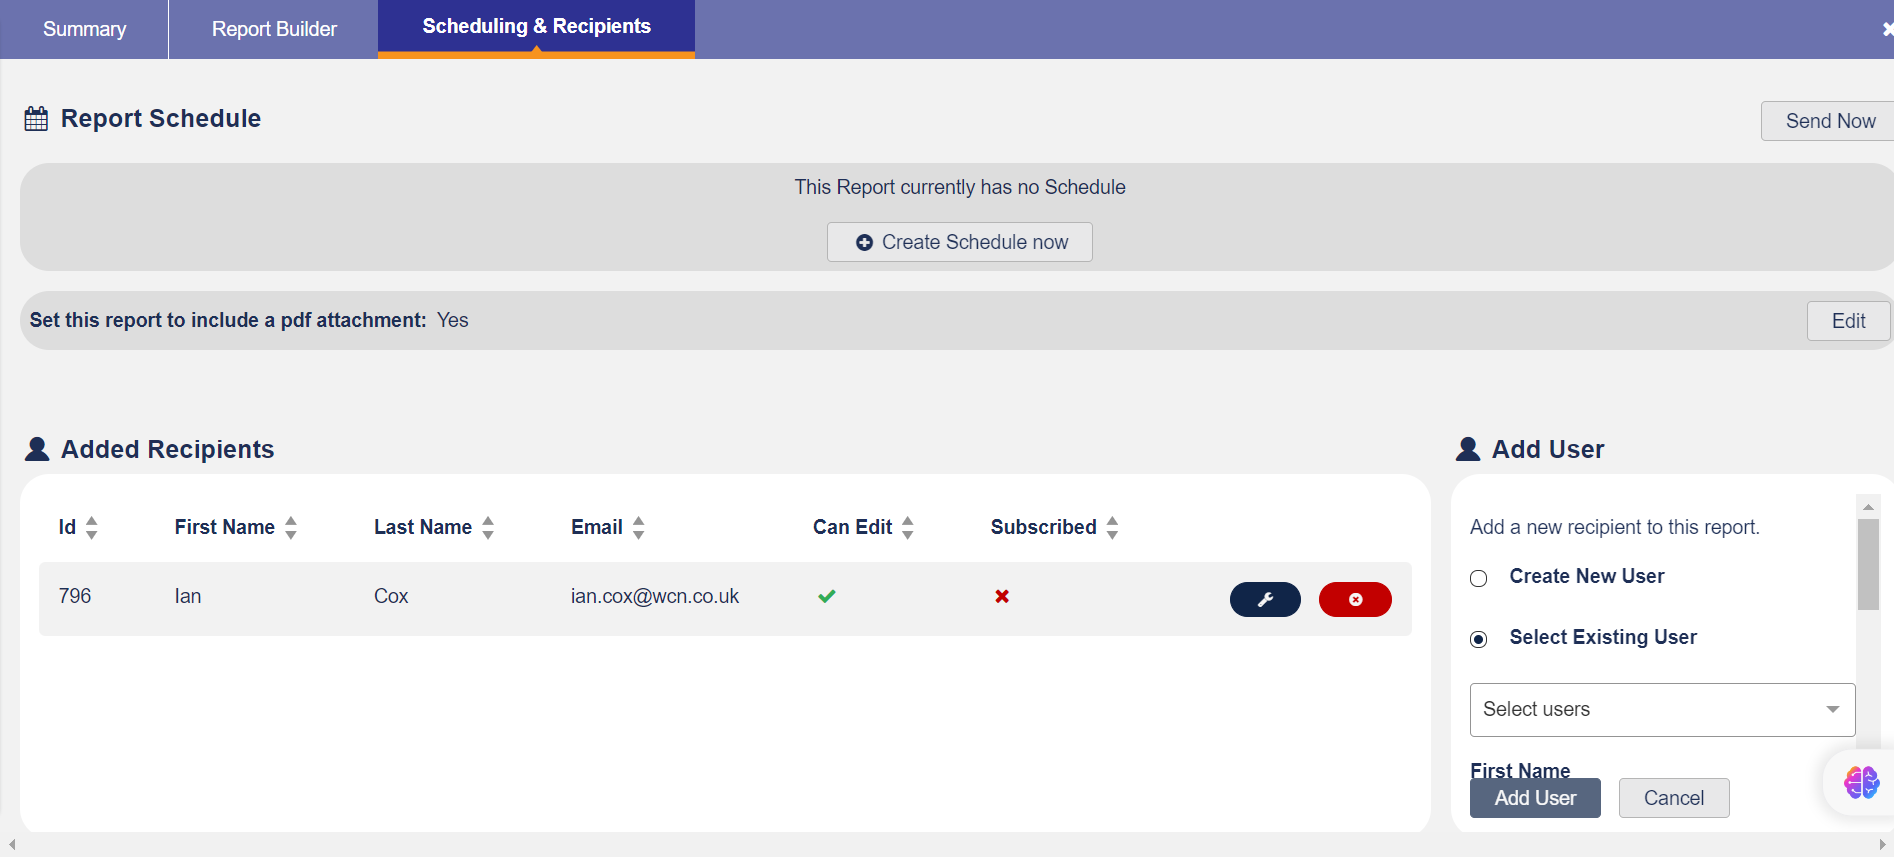
Creating a Report Schedule
In this section, you can create a schedule for when and how often you want your report to be sent out.

After clicking 'Create Schedule now', you will have the following fields to set:
- Schedule to first run on - Use the calendar date picker to select a date for the first day your report will be emailed out.
- at - Click the clock icon to select the time you would like the report to be emailed out.
- Schedule this report to run - This field determines the frequency of emails. You can select Once, Daily, Weekly, Monthly or Yearly.
Once you have the schedule set up as you would like, click on 'Save' and your report will be scheduled to be sent out!
Sending the report ad-hoc
You have the flexibility to send out the report instantly by clicking the 'Send Now' button, found in the top right of the tab.
The report will be delivered to all users listed in the 'Added Recipients' section with the 'Subscribed' option enabled.
You will not receive the report if you do not have 'Subscribed' enabled:
- It's important to note that if your 'Subscribed' option is not enabled, you won't receive the report, even if you are the creator of the report.
Presentation of report to recipients
By default, the emailed report includes a link leading to a webpage containing the report, capturing data as of the sending time. It's static and won't update with changes post-sending. Some interactive elements allow recipients to adjust charts by removing categories from the key. If 'Value breakdown tooltip' is enabled, it's visible during report inspection. Clicking a chart category prompts login.
You can also include a PDF attachment. Please note, the interactivity options described above are not available in the PDF version.
Adding/removing PDF attachment:
- To add/remove the PDF attachment, click 'Edit' next to 'Set this report to include a PDF attachment.
Managing the recipients list and access
All users added to the report are listed in the 'Added Recipients' section.

- The 'Can Edit' column indicates whether a user has permission to edit the report, while the 'Subscribed' column shows if the user will receive the report via email, either through a schedule or 'Send Now.'
- By default, the report creator is listed with 'Can Edit' enabled but 'Subscribed' crossed, meaning they won't receive the report if it is emailed.
- To adjust a user's settings, click the spanner icon next to their name.
- Only users listed as having 'Can Edit' access can adjust the recipients list.
Adding Users
Only users with 'Can Edit' access can add new recipients.
- In the 'Add User' section, choose 'Create New User' or 'Select Existing User.' If the recipient already has a profile, use the latter option.
- If creating a new user, input their details. Note: Only email domains cleared for your system can be used.
- Before clicking 'Add User' at the bottom of the form, consider two checkboxes:
- Allow new users to edit this report: Enables editing permission for the added user.
- Email scheduled report runs: Enables email delivery to the user.
Public Reports:
- When a report is marked as 'Public', all users with access to the Report Hub module can view it.
- Editing privileges are granted only to those listed as 'Added Recipients' with 'Can Edit' access.
- To switch a report's status from 'Public' to 'Private,' click the edit icon (pencil-to-paper) next to the report's name at the top of the page.
VIEWING REPORT'S SETTINGS FROM THE SUMMARY TAB
The summary tab is a simple quick overview of your report and its settings.
- Report Information will tell you if your report has a schedule set up and the next date of the report being sent
- Scheduled - will read as Once, Daily, Weekly, Monthly, or Yearly. On first creation it will read as Once until a schedule is set.
- Next Scheduled - will show the next date that the report will be sent out if a schedule has been set up
- Preview will contain a small image of the report once it has been built. clicking this image will open a full preview of the report in a new tab
- User & Recipients will list out all the users added to the report. Upon initial creation, only you will be in the report
- Can Edit - a green tick indicates that the user added has edit access to the report
- Subscribed - a green tick indicates that the user will receive any scheduled emails set up for this report
- History will show you the last few actions that were performed against this report
ADDING A REPORT HUB TO YOUR DASHBOARD
You can include 'Public' Report Hubs on your dashboard for immediate access upon logging in.
Guide to add Report Hubs to your dashboard


