


WHAT ARE THE TIPS?
💡 Here are our top 10 things that you wish you knew but were afraid to ask.
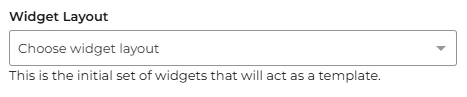
1 - Widget layout templates for Report Hub
💡 Save time and stay organised by creating reusable widget layout templates. These templates allow you to maintain consistency while building reports in the Report Hub creation menu.
🔧 Use Case: Quickly apply pre-set layouts to new reports, perfect for teams sharing similar reporting requirements.
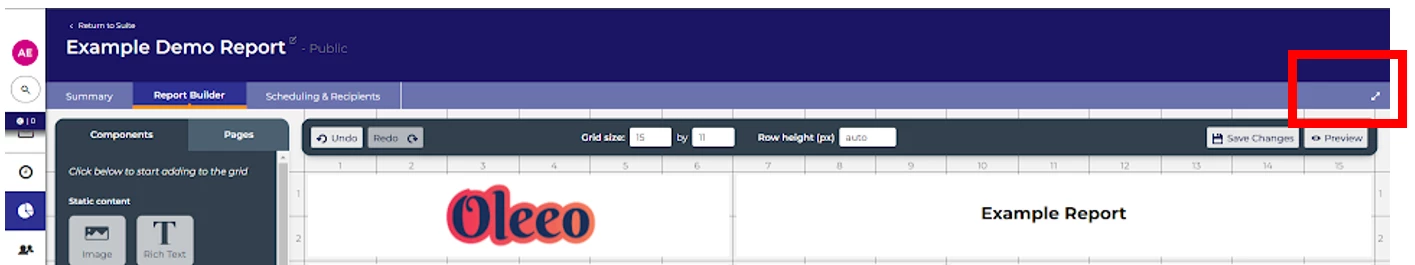
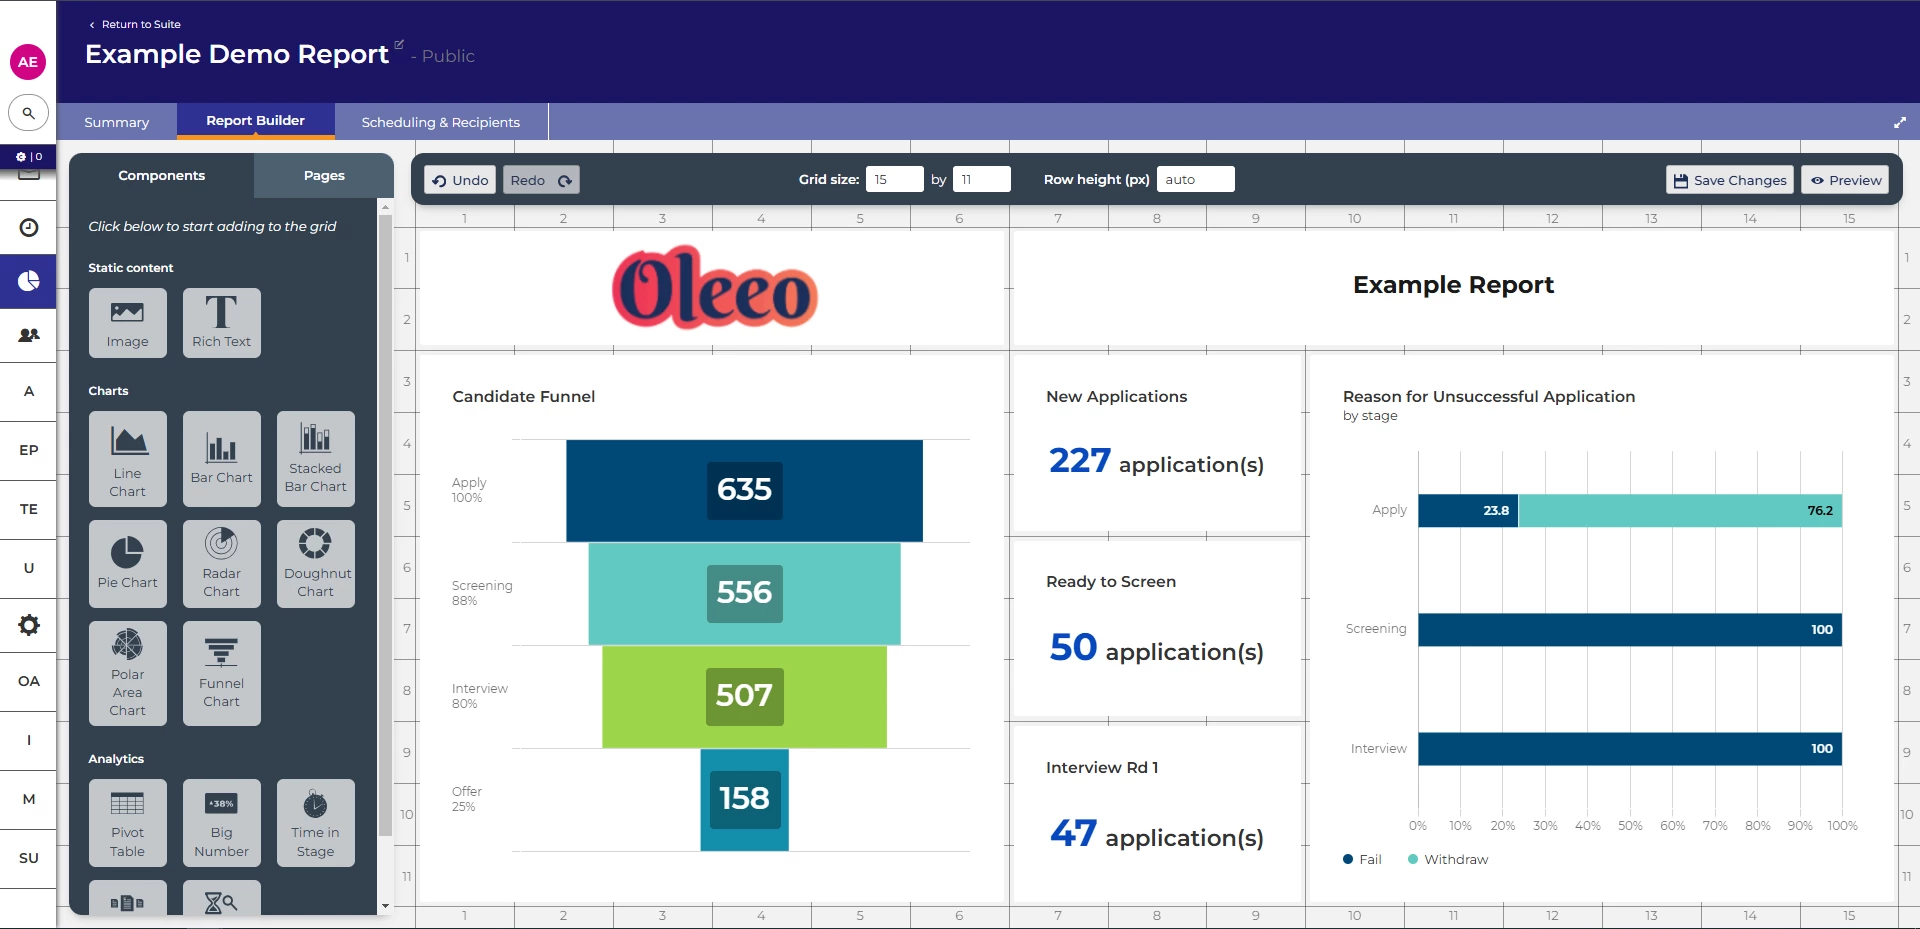
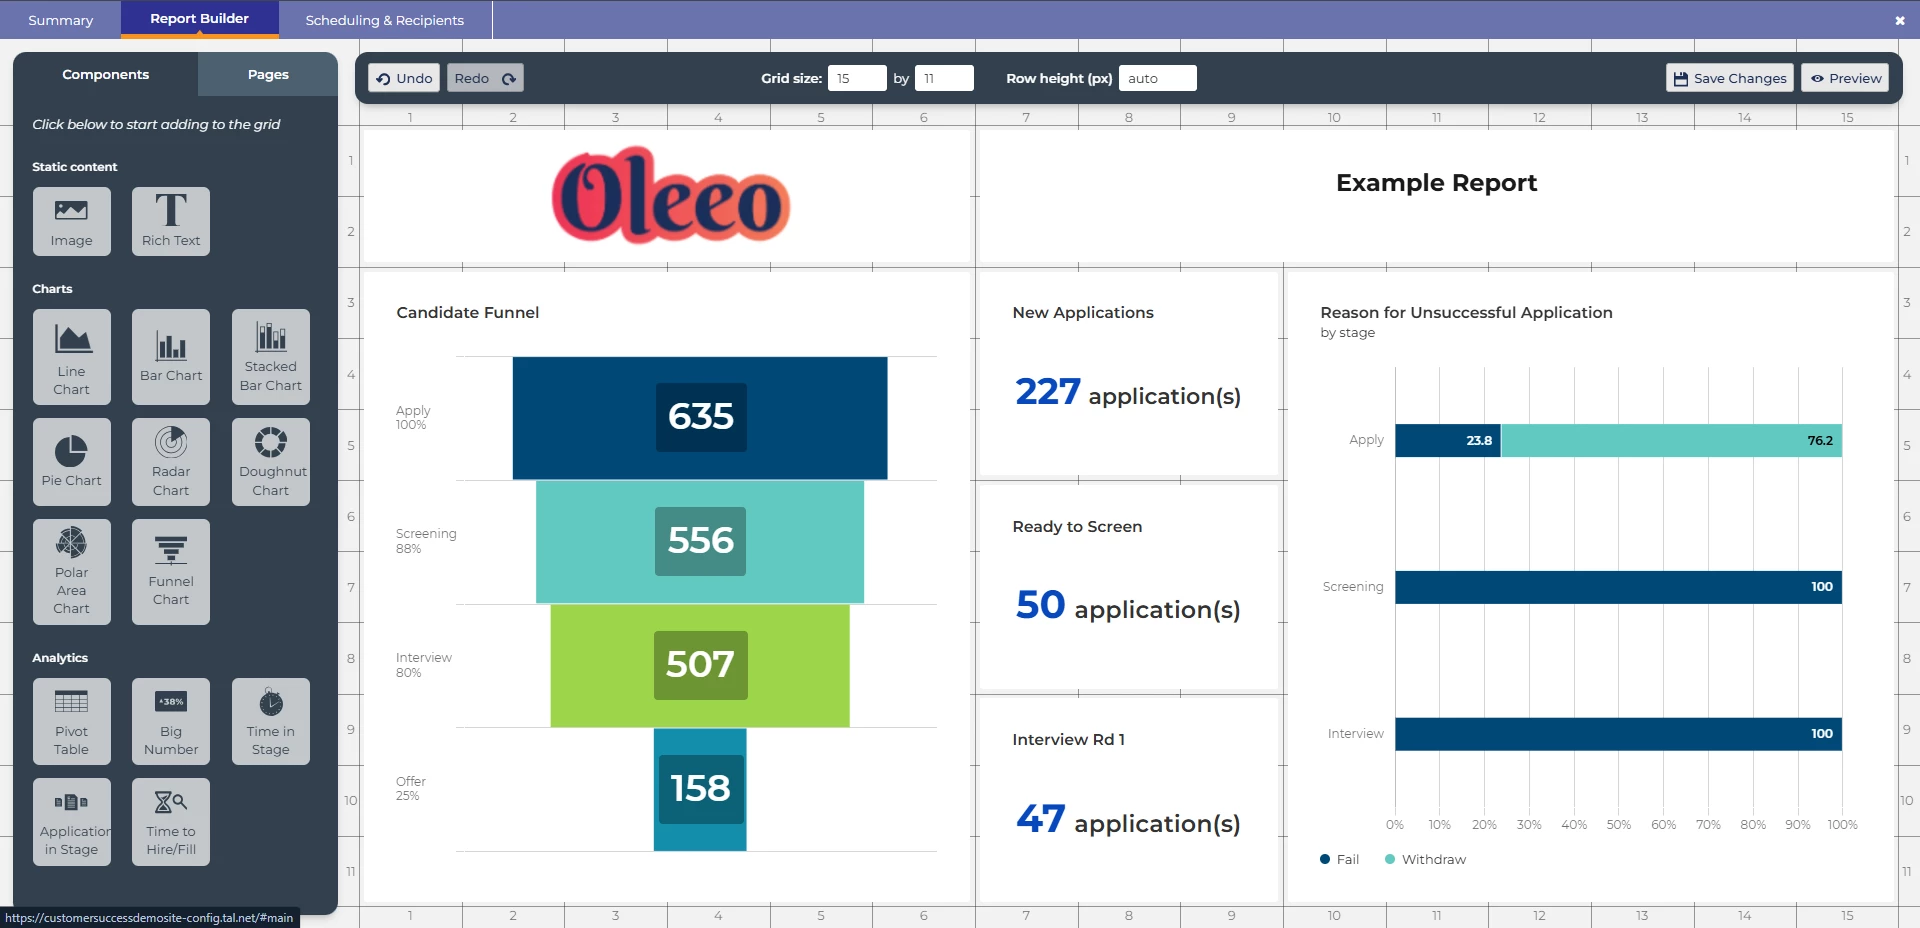
2 - Maximise your view
💡 Not everyone uses a second monitor, laptop screens can be restricting the amount of space on your screen. Using the maximise editor toggle will allow you to use your full window to build fantastic reports.
 |  |
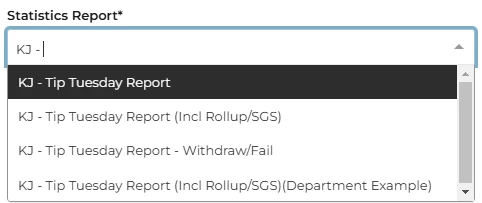
3 - Naming convention for stats reports
💡 Consistency is key, developing and maintaining a healthy naming convention when building reports will save you when it comes to locating them for your reporting requirements.
📌 Pro Tip: When using time period in your report like “This Month” or “Last Year” include this at the end of the title searching for all reports for “This Month” easier.
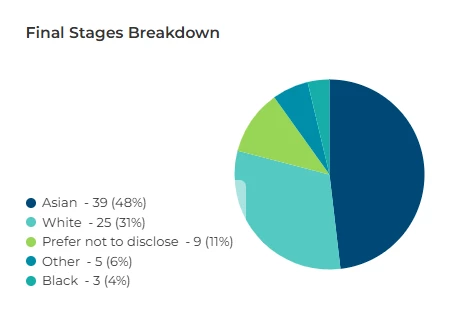
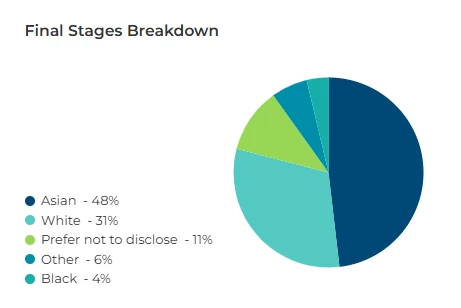
4 - Hiding the tooltip for sensitive data
💡 Tell the story without revealing sensitive information, hiding the numeric values allows you to share percentage values only, particularly useful for DE&I reports.
🔧 Use case: Protecting the identity of candidates that may be identified via low number reports
 |  |
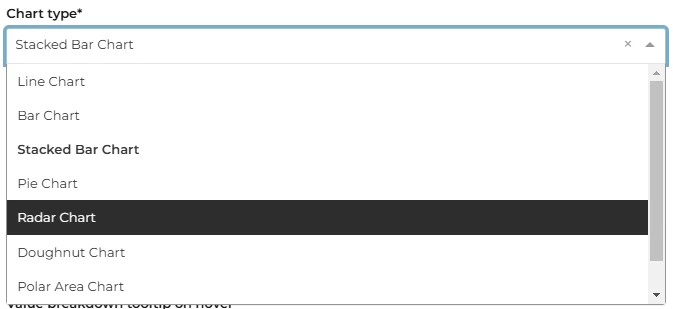
5 - Toggling the chart
💡 Want to see the data in a different format, edit the component and simply switch the chart type: line, bar, stacked bar, pie doughnut etc. Rather than adding a new component.
6 - Top X or full year results
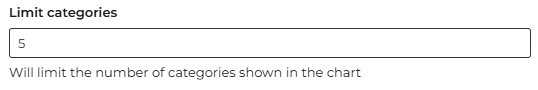
💡 Only want to show the top 5 items without amending the source report, reduce the default limit from 10 to 5
🔧 Use case: You have a large report that is current showing all of the sources of your hire this year, you only need to show the top 5. As the reports could be being used for other components or other reports, limiting the number of categories shown will provide you with a clearer set of data on your chart.
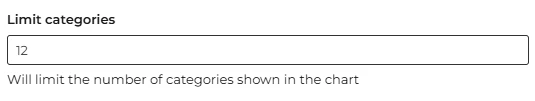
💡 Missing 2 months off your full year data? Don't forget to increase the default limit from 10 to 12
🔧 Use case: You build your statistics report to show the rolling 12m data for submitted applications, when using this in a Report Hub component the default limits will apply, removing the last 2 months, increasing from 10 to 12 will now show all of the rolling year report data.
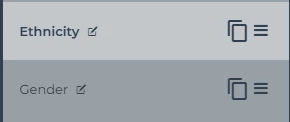
7 - Layout cloning
💡 Building a great looking page can take time to get right, choosing the correct component, adjusting all the settings and adding in any text or logos. Once finalised, save yourself time by copying the page to keep the same format, then toggle the reports to suit the story you're telling. This is great for similar sections of a report to keep the story telling consistent
🔧 Use case: Standardising report packs with data broken down by different factors, using the same design style.
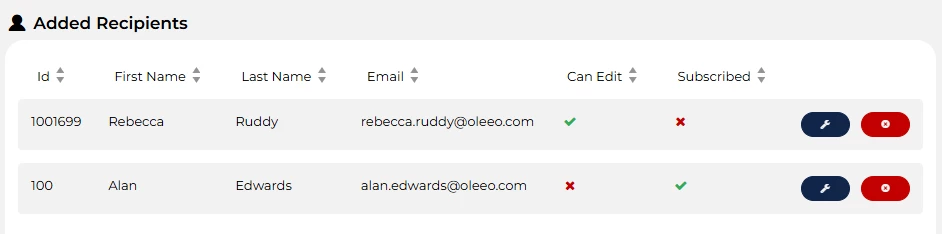
8 - “Are you receiving me?”
💡 Use the Send Now option to instantly share reports with recipients. Make sure they’re subscribed first!
📌 Pro Tip: Recipients don’t need system access. Create subscribers through the Add User section.
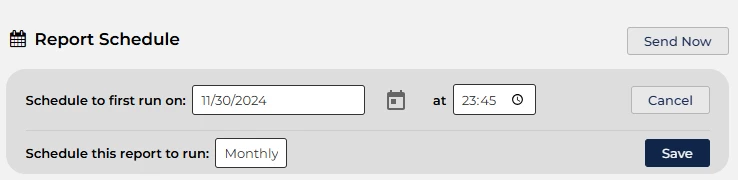
9 - Want a monthly or yearly report to land in your inbox without manual intervention?
💡 By using the pre-set date values in the stats report and a report schedule set to run at the end of the month, you can have a fresh report to review the next day.
📌 Pro Tip: When setting the run time, allow for server processing time of your scheduled report, by including a margin of time before the end of that day.
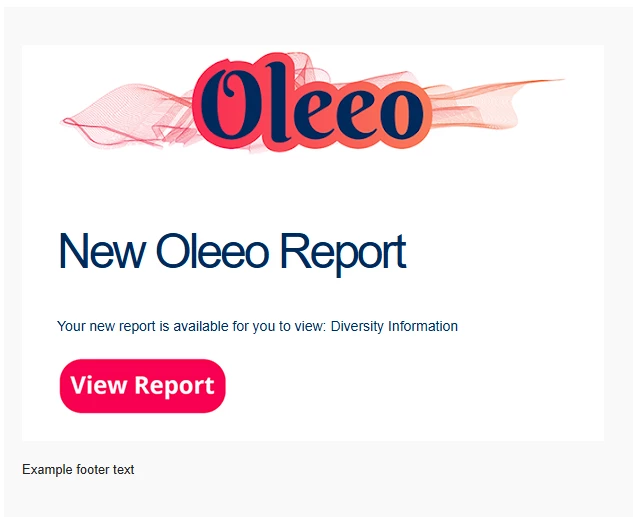
10 - Make your email stand out
💡 There is nothing worse than making a beautiful, insightful and impacting report but nobody views it. Updating the email template used for the Report Hub notification can really help get your report viewed by your audience.
📌 Pro Tip: Not a HTML expert? - We have included the code used for this example in the considerations section, please seek guidance from your marketing or communication team for your correct brand colours
If you have self config level 1 or higher, click on show content to reveal the email template source code.
Copy and paste into your email source code “<>” section, replace “ATTACHMENTID” with the correct attachment ID for your images.
[table width="100%" style="background-color: #F9F9F9; PADDING-TOP: 35px; PADDING-BOTTOM: 35px; padding-right: 15px;  padding-left: 15px; display: block;"]
[tr][td align="center"]
[table width="90%" border="0" cellspacing="0" cellpadding="0"]
	[tr]
		[td style="background-color: #ffffff; height: 75px; padding-right: 35px;  padding-left: 35px;"]
			[attachment="ATTACHMENTID"  ][/attachment]
		[/td]
	[/tr]
	[tr]
		[td bgcolor="#ffffff" style="COLOR: #002A5C;font-size: 48px;font-family: Helvetica, Arial, sans-serif;clear: both;line-height: 45px;letter-spacing: -3px;PADDING-TOP: 20px; padding-right: 35px; padding-left: 35px;"]
				New Oleeo Report
		[/td]
	[/tr]
	[tr]
		[td bgcolor="#ffffff" style="font-family: Helvetica, Arial, sans-serif; padding-right: 35px; padding-left: 35px; COLOR: #002A5C; font-size: 14px;"]

Your new report is available for you to view: [path]ereport.name[/path][br/][br/]

[urlpath="report_link" style="margin-top: 20px; display: block; align=centre"][attachment="ATTACHMENTID" style="margin-bottom: 20px; "][/attachment][/urlpath]

		[/td]
	[/tr]
	[tr][td bgcolor="#ffffff" ]


	[/td][/tr]
	[tr]
		[td style="font-family: Helvetica, Arial, sans-serif; background-color: #B7B7B9; height: 75px; padding-right: 35px; padding-left: 35px; COLOR: HEX: #A0AEC0; font-size: 13px;"]
		Example footer text
		[/td]
	[/tr]
[/table]
[/td][/tr]
[/table]
😊 Have a tip or trick you swear by in Report Hub? Share your success stories with us—we might feature them in a future Tip Tuesday!
BENEFITS
- Simplified report building with reusable layouts.
- Streamlined workflows to save time and effort.
- Enhanced clarity and accessibility of data.
- Automated processes that minimise manual intervention.
CONSIDERATIONS
- Some features, like HTML customisation, may require marketing or IT support.
- Always verify that recipients are subscribed before sending reports.
- You will need an Oleeo configurator with Level 1 config or higher to help update additional features (e.g., email templates).
COSTS
This feature is part of the standard product offering.
NEXT STEPS
For personalised advice, reach out to your Oleeo Customer Success Manager. Or, why not take it a step further and sign up for our Reporting Masterclass to sharpen your skills?
ADDITIONAL INFORMATION:


