

Also referred to as a Candidate Funnel or Hiring Funnel, the Recruitment Funnel serves as a powerful tool for recruitment teams to assess the effectiveness of their hiring process. It provides insights into the efficiency of each stage in filtering out unsuitable candidates.
OVERVIEW
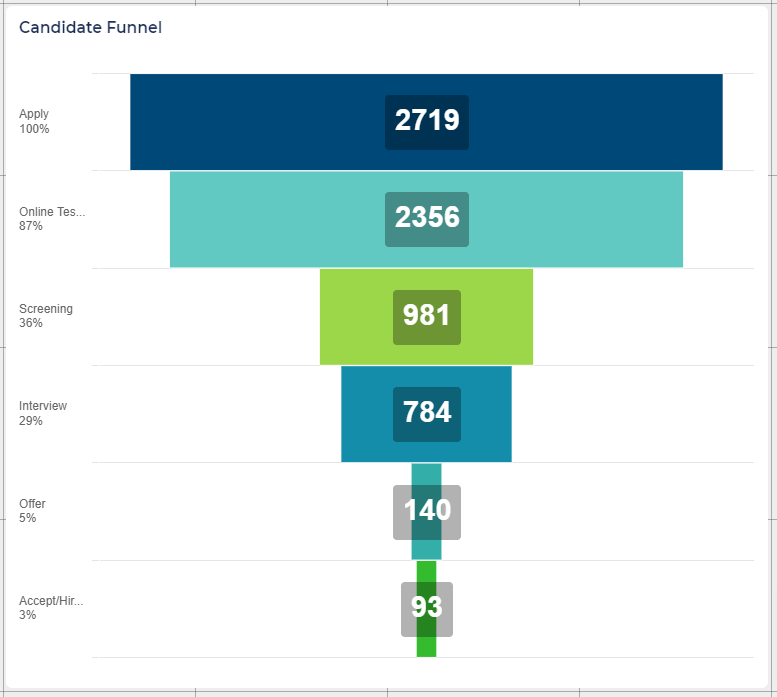
Below is an illustration of a Recruitment Funnel presented using a funnel chart in the Report Hub.
The general process for configuring a chart like this involves the following steps:
- Set up the Status Groups Sets in the Configuration Environment corresponding to the stages in your recruitment process.
- Create a statistics report (data table) based on the Status Group Set.
- Add a Funnel Chart into a Report Hub, utilising the statistics report as the data source.
This guide will walk you through each step of this process.
STEP 1: SET UP THE STATUS GROUPS SETS
Setting up Status Group Sets requires Self-Configuration Level 1 access:
- If you don't have this level of access, you will need to get support from one of your Super Users.
A Status Group Set is essentially a collection of Status Groups, each representing a stage in your recruitment process. The sets can be used as axes in Statistics Reports (Data Table).
In this guide, we specifically detail the setup of a Status Group Set designed for Recruitment Funnels. When working on this type of report, ensure you include all statuses that make up a stage, including terminal statuses such as 'reject'. This ensures the report captures all applications that reach a stage.
You can also use Status Groups for focused Time in Stage reporting. These groups should only include active statuses. We cover creating a Time in Stage report in another guide.
During implementation, Status Group Sets might have been set up for you. Super Users can modify existing Status Group Sets or create new ones.
Examples of recruitment stages (Status Groups):
Here is an example of the Status Groups that could comprise a Status Group Set:
- Apply stage - the statuses that a candidate may enter before they have submitted their application.
- Screening stage - any statuses that a candidate could enter while being screened for interview.
- Interview stage - any interview statuses (invite, scheduled, feedback, 2nd round, etc.)
- Offer stage - from being selected for offer (conditional, unconditional, etc.) to the offer being extended.
- Hired stage - from the candidate accepting the offer to the hire being complete.
Creating new Status Groups Sets:
- Login to the Configuration Environment:
- You will need to be logged in to the Configuration Environment as a super user with Self-Configuration Level 1 access.
- Navigate to the Status Group Sets page:
- In the left-hand menu, navigate to Configuration > Process > Status Group Sets.
- Create a new Status Group Set:
- Select 'Create' in the toolbar.
- Enter a name - a good name would be "Application Stages (All Statuses)".
- This will be the name that is given to the Status Group Set in the Data Dictionary.
- Enter a description.
- For 'Status Value type', select 'Recruitment'.
- Click 'Create'.
- Create a new Status Group for each stage:
- Within your Status Group Set, navigate to the 'Status Groups' tab.
- Click the 'Add' button.
- In the 'Details' tab, give the Status Group a name (e.g. 'Apply')
- In the 'Status Value' tab, add Status Values from the 'Available' list to the 'Selected' list.
- Ensure all statuses that make up the stage have been added to the group, including the reject statuses.
- Click 'Submit' to create the new Status Group.
- Add the Status Group Set to the Data Dictionary:
- To use the Status Group Set in report creation, make sure to add it to the Data Dictionary.
- Navigate to the 'Details' tab in the Status Group Set and choose a relevant category in the 'Add to Data Dictionary' field.
- Arrange for your Configuration system to be pushed to Live:
- As with all configuration changes, you will need to arrange for your system to be pushed to Live.
Include Reject/Fail/Withdrawn statuses in stage:
- For each stage, their corresponding Reject/Fail/Withdrawn statuses should also be included.
- If you do not include these statuses, candidates in these statuses may not be counted as reaching the stage.
Status Values can only be added to one Status Group:
- You cannot add Status Values to multiple Status Groups within a Status Group Set.
- When all statuses are accounted for, you won't be able to add more to any group.
STEP 2: CREATE A STATISTICS REPORT BASED ON THE STATUS GROUP SET
After creating a Status Group Set for your Recruitment Funnel and arranging for it to be pushed to Live, you can now create your Statistics Report(Data Table).
To do this:
- Initiate the process and select Report Type:
- Navigate to 'Statistics' > 'Standard Reports' in the left-hand menu.
- Click 'Create Report' in the Report List Action Toolbar.
- In the pop-up box, choose 'Application' as the 'Report Type'.
- Click 'Create Report'.
- Select the Population for the report:
- If no population is specified, the report will include all applications or opportunities that you have access to.
- You can filter the population based on specific criteria, using fields from the Data Dictionary, including free-text fields.
- Consider filtering by Submission Date or focusing on a particular business area.
- For detailed guidance on selecting populations, refer to Selecting the target Population for reporting.
- Add the Status Group Set as an axis:
- Click the 'Add Axis' button below the Population.
- In the pop-up box, use the soft search to find your Status Group Set (named as per its Details tab).
- After selecting the field, click 'Add Axis'.
- In the next box, leave the 'Minimum Percentage Threshold' field blank.
- Check the 'Cumulative' checkbox.
- Click 'Submit'.
- Save the report:
- In the Statistics Action Toolbar, click 'Save As'.
- Complete the form and click 'Submit'.
Making the axis Cumulative is an important step:
When you add a Status Group Set as an axis, make sure you add it as Cumulative. Setting the axis to cumulative means that each row (in this case, each Status Group in the set) will have a value that represents all candidates that have ever been in at least 1 status that existed in that status group. This will allow you to see a clear funnel from the start of the process to the end.
Funnel Charts can only display one axis:
- Funnel charts are designed to represent data from a single axis of a Statistics Report.
- The funnel chart will always use data from the first vertical axis.
STEP 3: ADD A FUNNEL CHART INTO A REPORT HUB
Now that you have set up your data source to display the data as you want it, you are ready to add the Funnel Chart component to your report in the Report Hub.
- Navigate to the 'Report Builder' Tab:
- Access the 'Report Builder' tab within your Report Hub.
- Select the Funnel Chart component:
- In the report builder menu to the right of the grid, click 'Funnel Chart'.
- Place the Component:
- Click the cell in the grid for the component's top left-hand corner.
- Click another cell for the component's bottom right-hand corner.
- Complete the the fields in the pop-up window:
- For 'Statistics Report', select the report you created that has the Status Group Set as its first vertical axis.
- Click 'Update' to add the report.
- Save your changes:
- The report does not automatically save when a new component is added.
- Make sure you click the 'Save Changes' button in the grid toolbar before navigating away from the page.
